Site Timeline: The Tool for System Visualisation

The new sub-system "Site Timeline" is a tool for system visualisation. It serves to expand condition awareness and better progress documentation. The Timeline is in the same vein as the Health Dashboard: a user-friendly interface for viewing the events that have been reported via the Analytics API.

Table of Contents

Flexible handling

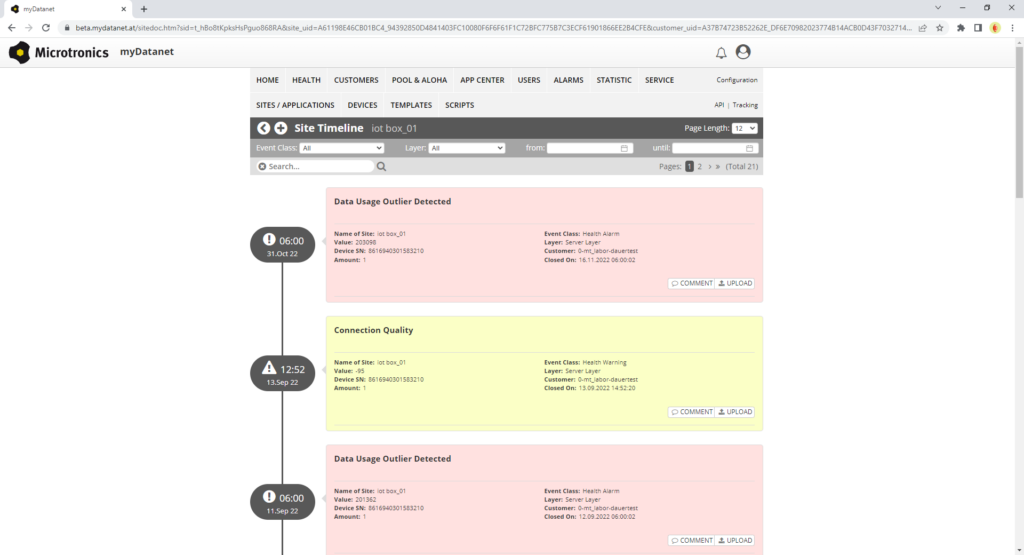
While the Health Dashboard only displays open events and presents a snapshot of the current system status, the Timeline is a tool to filter and view the history of all events that have occurred. Furthermore, the timeline offers the possibility to make entries yourself, to comment on existing entries and to add pictures or documents.

Manual timeline entries

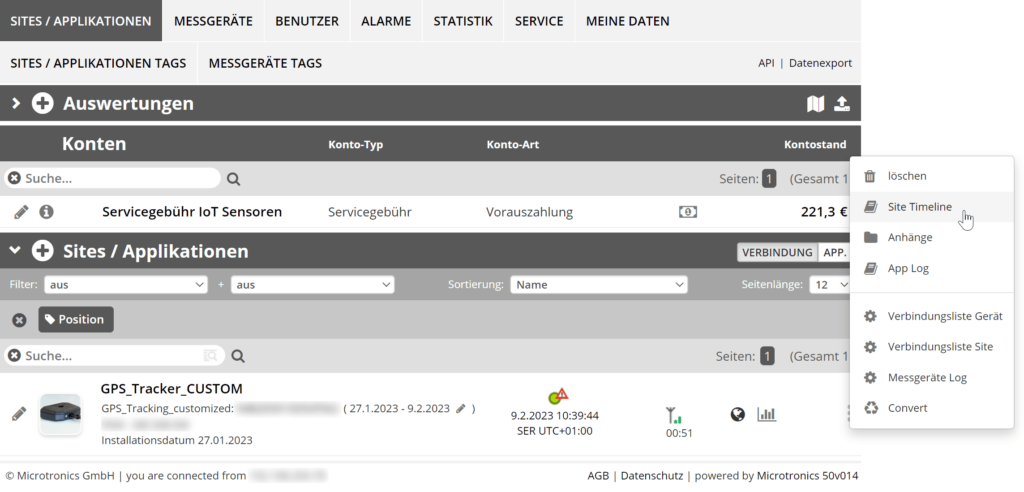
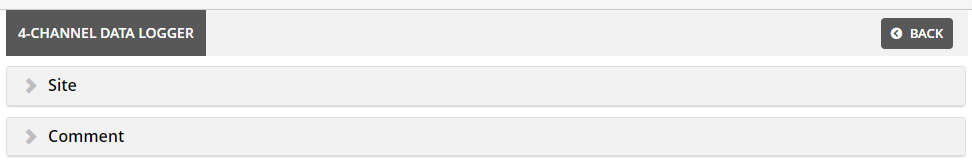
Manual site timeline entries can be created directly on the site. To be found in the site list on the right as a sub-item “Site Timeline”.

Create Site Timeline entries manually

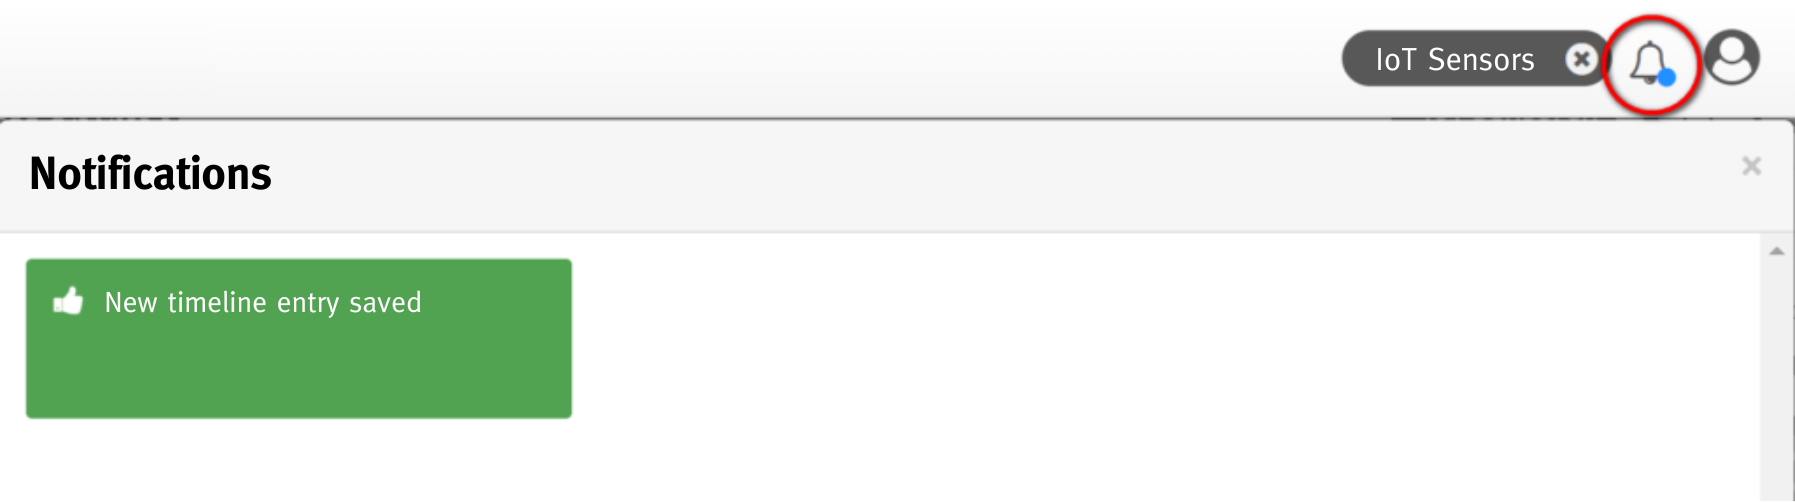
New site timeline entries are displayed as notifications in the message centre:

Notification for new timeline entry

Upcoming: Automated timeline entries

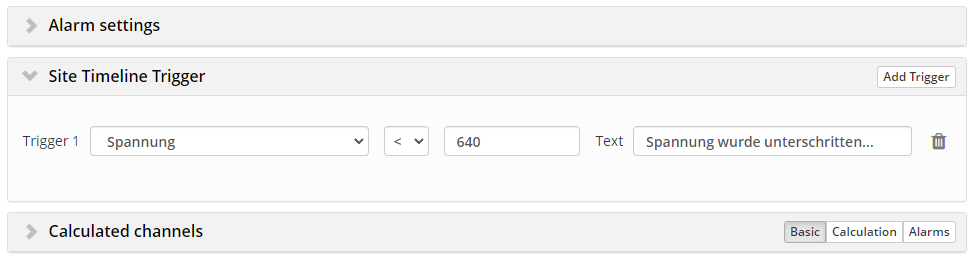
In the near future, we can expect a particularly practical feature, namely the automated creation of timeline entries. The success of Microtronics systems is based on the collection and visualisation of a large number of data points. In order not to lose the overview in this amount of data and to keep an eye on the relevant variables, the timeline offers the simple possibility of making relevant limit values visible parallel to the extended alarming system. At site level, it will soon be possible to create a threshold trigger for a data channel easily and without programming knowledge. When the threshold of this data channel is reached, an entry is automatically created in the timeline. Of course, the existing alarm module will also learn to create entries in the timeline.

site timeline

site timelIne trigger

Visible in evaluation graphics

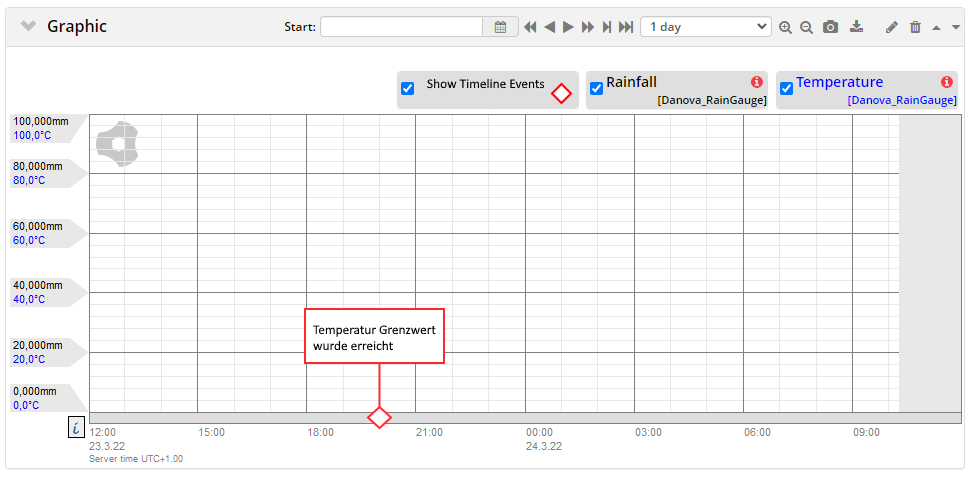
For all enthusiastic users of our evaluation graphics: The new timeline is also integrated here. All timeline events can be made visible as a separate data dimension on the evaluation graphics. In addition, new entries can also be created on the timeline in the evaluation graphic.

Site Timeline evaluation graphic

From theory to practice

YouTube

Mit dem Laden des Videos akzeptieren Sie die Datenschutzerklärung von YouTube.
Mehr erfahren

Video laden

What other features does the IoT platform have to offer?

Kanal-Entlastung in den Fluss mit drei Enten
Applications

Implementation of the EU Urban Waste Water Treatment Directive

The EU Urban Waste Water Treatment Directive protects the environment from harmful effects caused by the discharge of urban waste water; The guideline dates back to 1991 and is currently being revised; The planned innovations strengthen environmental protection. At the same time, this is accompanied by stricter requirements for sewer network operators, wastewater treatment plants and manufacturers.

In the following, we summarise the most important key points, show what the implementation of the EU Urban Waste Water Treatment Directive means for combined sewerage systems and provide an insight into the possible technologies that support implementation.

Ăśberlauf bei Starkregen bei einem Kanaldeckel
Applications

Heavy rainfall and effects on sewers: Data logger for heavy rain monitoring

Heavy rainfall events are occurring more frequently worldwide and pose an increasing challenge for wastewater systems. The intensity and frequency of heavy rainfall events are being intensified by climate change, which can lead to overloading of sewers. In this article, we analyse the effects of heavy rainfall on sewers and discuss possible solutions to the problem. In particular, we look at the opportunities and possibilities with data loggers.

In order to use our live chat, you must agree to the loading of Hubspot cookies. You can find out more about this in our privacy policy.