Do you rely on IoT for your business-critical applications? Does your business model include widely distributed devices, machines or edge devices? Maybe even in places that are difficult to access?
When your device has been in use for a few months, you will start to ask yourself questions such as: “How long will the battery actually last?” Proactively sending an employee to replace the battery is one option. However, it is much more efficient to send you employees for maintenance only when it is really necessary.
Humans are distrustful beings. Your water level measuring station has not sent an alarm for weeks. Slowly the doubts creep up in you “Why do I not get alarms anymore? Is the system still working properly at all?”

Keep an eye on the health of your system
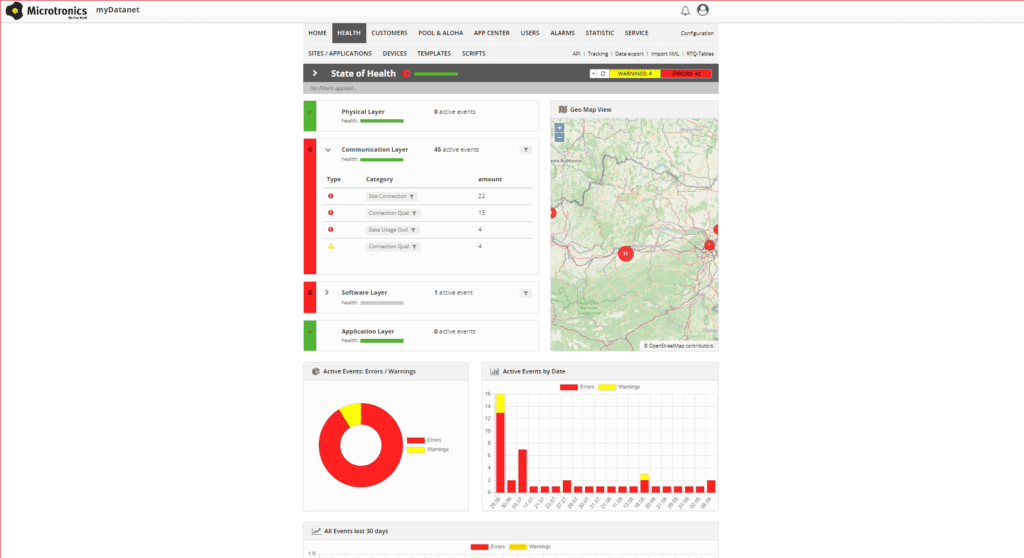
With version 49 the Microtronics IoT platform “myDatanet” receives a health dashboard. The dashboard collects all operationally important data about the status of your IoT application. The dashboard shows a snapshot of all events occurring in the system. Each of these health values is provided in a so-called “Analytics Agent” (short Agent).
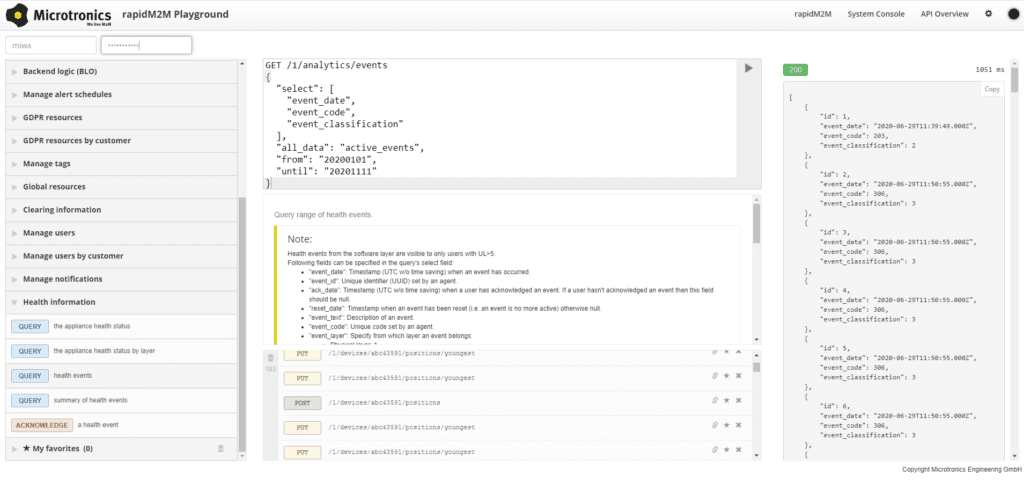
Analytics Agents can be installed on your IoT platform instance via the App Centre. Software developers can develop their own Analytics Agents in the rapidM2M Studio and create a customised live monitoring of the health status of their IoT system. The Health API is also available for developers. This allows to add the agents into existing monitoring systems. The detailed documentation can be found as usual in the Playground.

The Analytics Agents can be created at the appliance level (health status of the IoT platform) and at the application level (health status of each individual device).
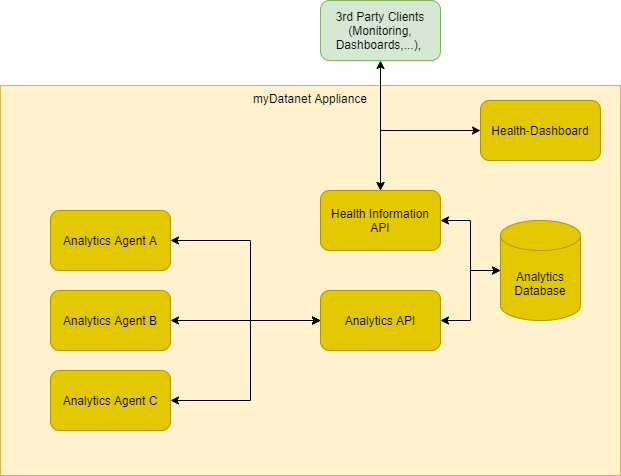
The structure of the health system
The health dashboard visualises the data of the health system. This collects the data of the so-called Analytics Agents or short agents. The agents monitor events throughout the system – from the IoT platform itself, through connectivity to the device in the field.

The agents are available in the App Centre. Beside several standard agents, custom agents can be developed. This allows each user to create his own individual monitoring routine.
The advantages of the health system
- The correct function of the system can be seen immediately. All relevant information for the operative business is collected.
- The agents can be added to existing monitoring systems via the API.
- Development of own, application-specific agents for direct integration into the health dashboard is possible.
- Based on the health events, own processes can be initiated, such as triggering maintenance.
- Representation from different angles to get a clear picture of the origin of the events:
- Geographical map to identify local events
The most important health statuses
The App Centre already provides the most important “Standard Agents”, which are relevant for almost every IoT application. These will be extended bit by bit.
Standard Agents at Appliance level
Disk Space Analytics Agent
The agent monitors the local hard disks on the appliance and triggers an alert if the storage space changes uncharacteristically or falls below limit.
SSL Certificate Analytics Agent
The validity of the installed certificate is monitored. The agent periodically checks security status of the certificate.
Windows Update Check Analytics Agent
The agent periodically checks whether the appliance’s operating system is patched. It triggers a warning if updates are available.
Standard Agents at Application level
Connection Quality Analytics Agent
The agent provides a message when the signal quality of a device falls below a certain value.
Data Usage Outlier Detection Analytics Agent
The agent checks whether the traffic between the appliance and the device is behaving abnormally and if so, triggers an event in the health dashboard.
Connectivity Analytics Agent
The agent monitors the connections to the devices and informs the health dashboard if they do not behave as usual (e.g. an online device is not online or a device do not report in the set interval any longer).


