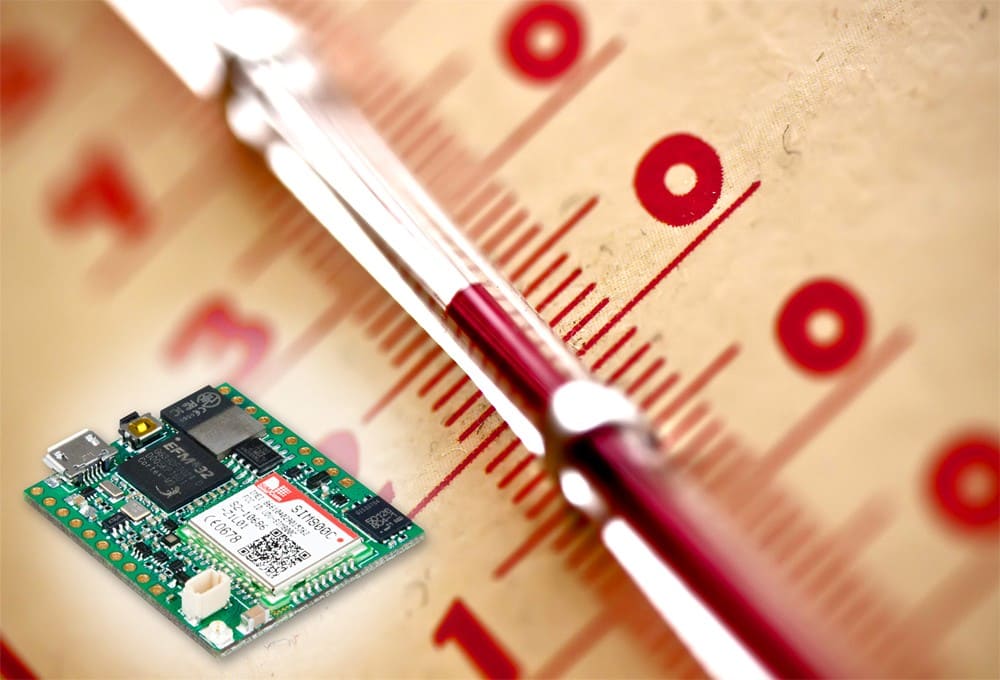
In this tutorial we will use the example of a „wireless thermometer” to view sensor values on the web. We rely on the toolbox provided by Microtronics. This allows us to focus on the application whereas the transmission, archiving and management of the data and configurations, as well as the management of the devices, is handled by the provided technology platform. So what is the point of it all?
The added value of information technologies
The inclusion of information technology makes it possible to extend the characteristics of existing products as well as the range of services offered. However this must not only serve the purpose of itself. “Because we can!” is not a sufficient justification for the use of information technology.
There is always a benefit to be created. This could be the additional values for which the customers are willing to pay or the understanding of the customers for the product as well as the use of the products by the customers. Such insights are of great value for product development and the creation of tailor-made services.
That is why the business model should always be the centre of attention in the beginning. The technology can only be viewed as an enabler of the business model. The collected and transmitted data during the course of the use of smart connected products allows the expansion of the business model far beyond the point of sale.[1]
In contrast to traditional products, companies do not lose direct access to their products, thus enabling models such as “product-as-service”[2] or “sensor-as-service”[3].
Technological infrastructure
Now we turn to the technological aspects. The creation and operation of a completely new technological infrastructure is required for the use of smart connected products.[4]
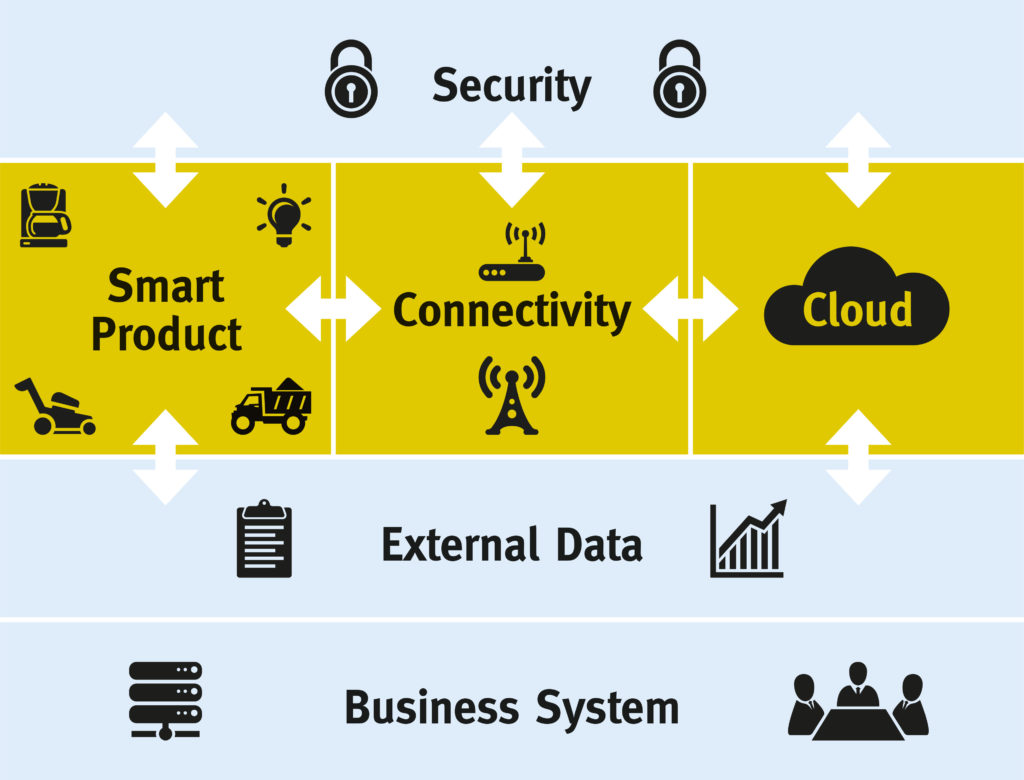
This includes simplified three levels (product, connectivity, cloud). The product itself has to be extended by sensors, microprocessors, data storage and interfaces. In terms of connectivity, the technological infrastructure includes the implementation of communication protocols for the data exchange between product and cloud. The cloud represents the sum of the functions and services that exist outside the physical product.

It is important that security is always ensured across these three levels, as well as the possibility to integrate external data. Furthermore a connection to other business systems (such as ERP, CRM or PLM) is required[5].
By choosing a technology platform that takes these considerations into account, you can save a lot of development time and concentrate on the development of your application.
Tutorial
In the tutorial we deal with the software of the product (script) and an “intelligent product application” (dashboard), which is part of the cloud. The remaining components of the infrastructure are provided by Microtronics.
Data container and REST API
The technology is based on a storage-to-storage synchronization. That means that the physical device is linked to a virtual image on the server. For each connection to the server, the firmware of the device ensures that the data containers (data records, configuration, etc.) are synchronized between the device and the server.
Using the API functions of the firmware, the data required for implementing of the application can be written to or read from these containers.
If the data were transferred to the server, they can be read out via the REST-API. This allows you to create your own dashboards or smart phone apps that receive their data from the server through this REST API.
In order to communicate the structure (the meaning of the individual bytes) of the used data containers to the server, the so-called “Connector” must be defined. That’s the only way to use measurement data and configurations in connection with the interface of the server be used for reports and visualizations. The structure of the data containers must also be known by the server for the specific access to individual configuration parameters or measured values via the REST API.
The first steps
It is recommended to start the development of an M2M / IoT application with the definition of the connector. As already mentioned, first of all you have to consider which measured values and configuration parameters are required for the realization of the desired application. In our case, these are the measured values “battery voltage”, “USB charge voltage” and “temperature” as well as the configuration parameters “recording interval”, “transmission interval” and “connection type”.
With the definition of the connector you have defined the specifications for the script as well as for a dashboard of a smart phone app.
Step by step to the visualisation
Phase 1: Define the connector
Phase 2: Create the application script
Phase 3: Visualise the data on the cloud server
Phase 4: Access to the data and configurations via the REST API of the cloud server using the rapidM2M Playground
Phase 5: Create your own dashboard
You will learn how to set the data structure (the connector) required to exchange data between the device, the cloud server and external systems, create an application script using rapdiM2M Toolset and load it into the device via the USB interface.
Furthermore, you will learn to use the reports to display the data on the cloud server and get an overview of how the data can be read out via the REST API of the cloud server.
Finally you create your own dashboard to display the data and enter a configuration parameter, where the dashboard that you create accesses the corresponding information stored on the cloud server via the REST API.
For the tutorial you need:
| rapidM2M M3 | or | T-Mobile IoT Box |
| IoT BoxTutorial |
Literature list
- ↑ Mayer, P. (2010, März). Economic aspects of SmartProducts. Whitepaper. Instute of Technology Mangement, University of St. Gallen, S. 4. Abgerufen von http://www.smartproducts-project.eu/media/stories/smartproducts/publications/Whitepaper_Economic_Aspects_Of_SmartProducts.pdf
- ↑ Porter, M. E., & Heppelmann, J. E. (2014, November). How Smart, Connected Products Are Transforming Competition. Harvard Business Review, S. 84
- ↑ Fleisch, E., Weinberger, M., & Wortmann, F. (2014). Geschäftsmodelle im Internet der Dinge. HMD Praxis der Wirtschaftsinformatik, 51(6), 812–826, S. 822. https://link.springer.com/article/10.1365%2Fs40702-014-0083-3
- ↑ Porter, M. E., & Heppelmann, J. E. (2014, November). How Smart, Connected Products Are Transforming Competition. Harvard Business Review, S. 68
- ↑ Porter, M. E., & Heppelmann, J. E. (2014, November). How Smart, Connected Products Are Transforming Competition. Harvard Business Review, S. 69


