
Counters are used in a wide field of applications. From the monitoring of energy flow, to the collection of inventories to the counting of persons – there are manifold possibilities. Many of them, such as energy meters, do their job lonely and hidden in the basement or at remote outposts. Every now and then visitors come by to read the actual count and manually transfer the data to a system.
An automated data transmission leads to a significant reduction of the efforts. This can result in a reduction of costs. The ability to retrieve meter readings at negligible costs at any time also opens up a range of new business models such as “Product as a Service”. In this model the product remains in the property of the manufacturer. He is fully responsible for all costs associated with the operation of the product. In return, an ongoing fee is charged (see Porter & Heppelmann; How Smart, Connected Products Are Transforming Competition; p. 84).
“Product-as-a-Service” requires complete coverage of usage. This is achieved through automated data transmission, this means the inclusion of information technology. The service rendered can thus be charged exactly. Especially if several customers share one product, this is relevant, e.g. for vendors in the Sharing Economy. The use of a product, if it is needed, is above the desire to own it. Car sharing or the sharing of expensive, rarely used tools and machines are just some of the possibilities.
Tutorial Smart Stadium
The Smart Stadium tutorial demonstrates how to make the state of a conventional pulse output counter available on the web using the toolbox provided by Microtronics. The counter is thus transformed into a smart counter. The transmission, archiving and administration of the data and the configuration as well as the management of the devices are done by the provided technology platform. You can therefore focus completely on the application and the added value to be generated for the customer.
For an explanation of the added value of information technology and a description of the technological infrastructure needed to transform a traditional product into a smart one (in this case a meter) see the blog article “From sensor to the cloud – What?”.
Step by step to your smart meter
Phase 1: Configuration of a report
Phase 2: Activate additional functions of the script
Phase 3: Change the use case
Phase 4: Create a measuring point using an application template
You will learn how to load a pre-compiled application script into the device via the interface of the cloud server, gain an overview of the basic handling of configuration parameters and learn how to display data on the cloud server using the reports.
For the tutorial you need:
- T-Mobile IoT Box
- Demonstration unit “Smart Stadium”
- Tutorial Smart Stadium
- Applicationsscript Smart Counter

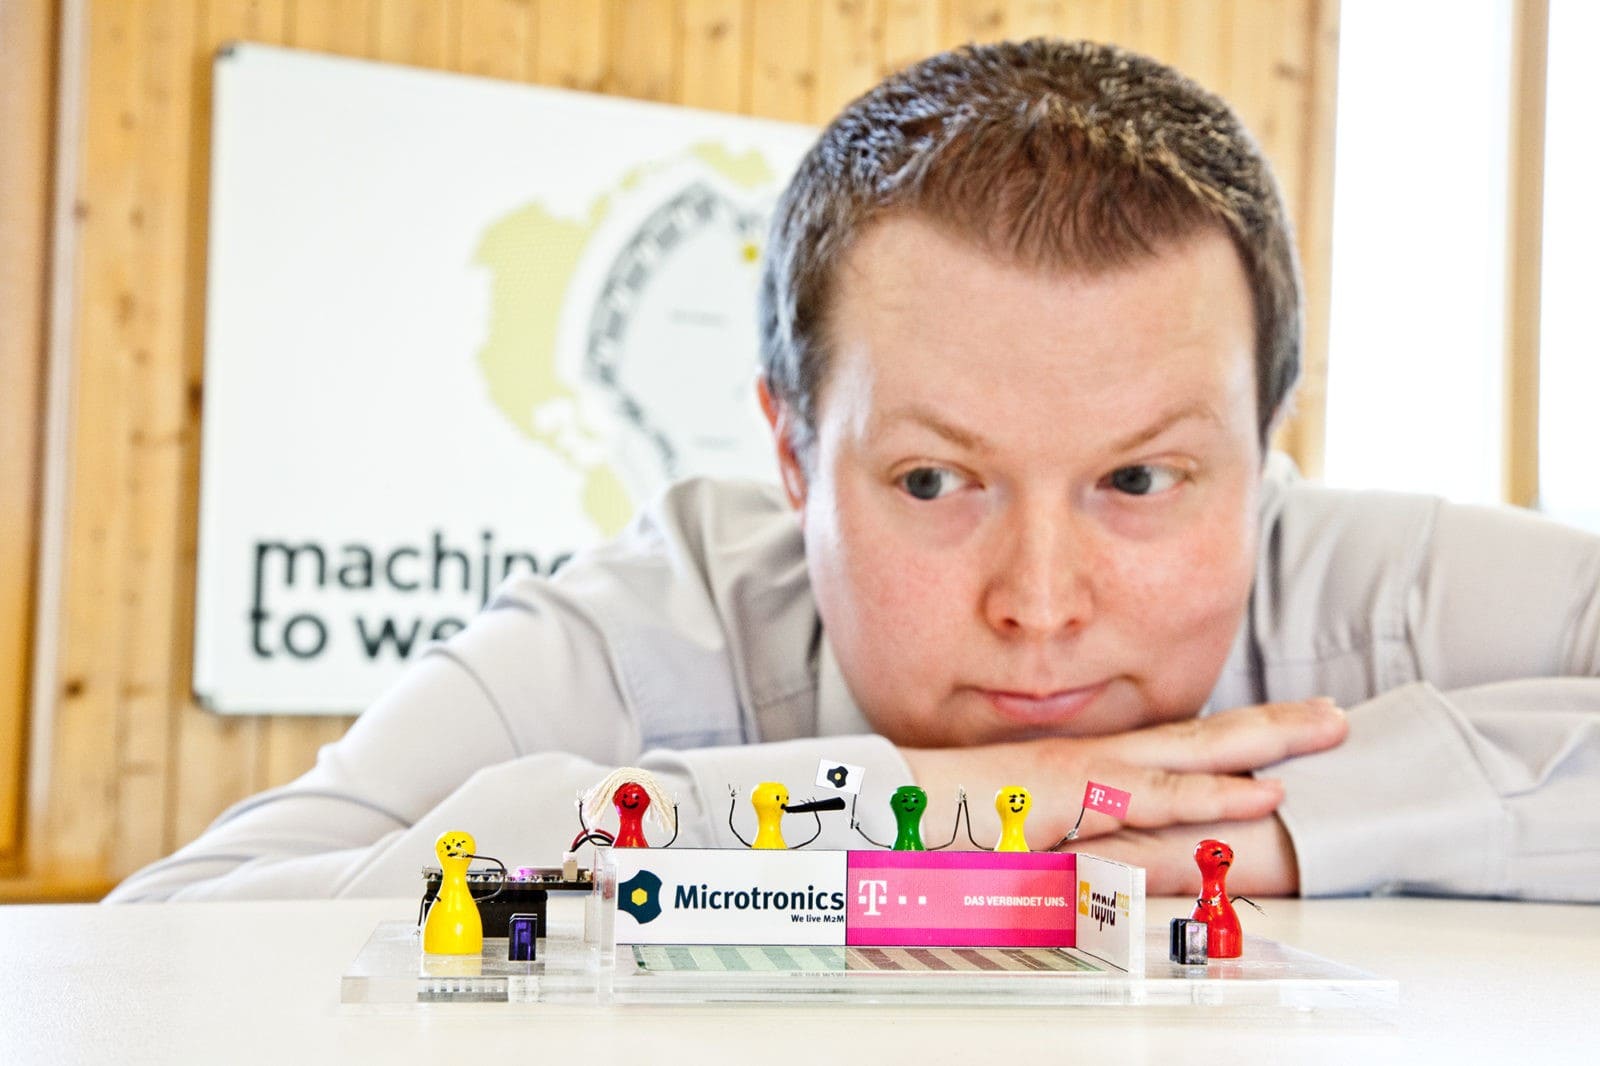
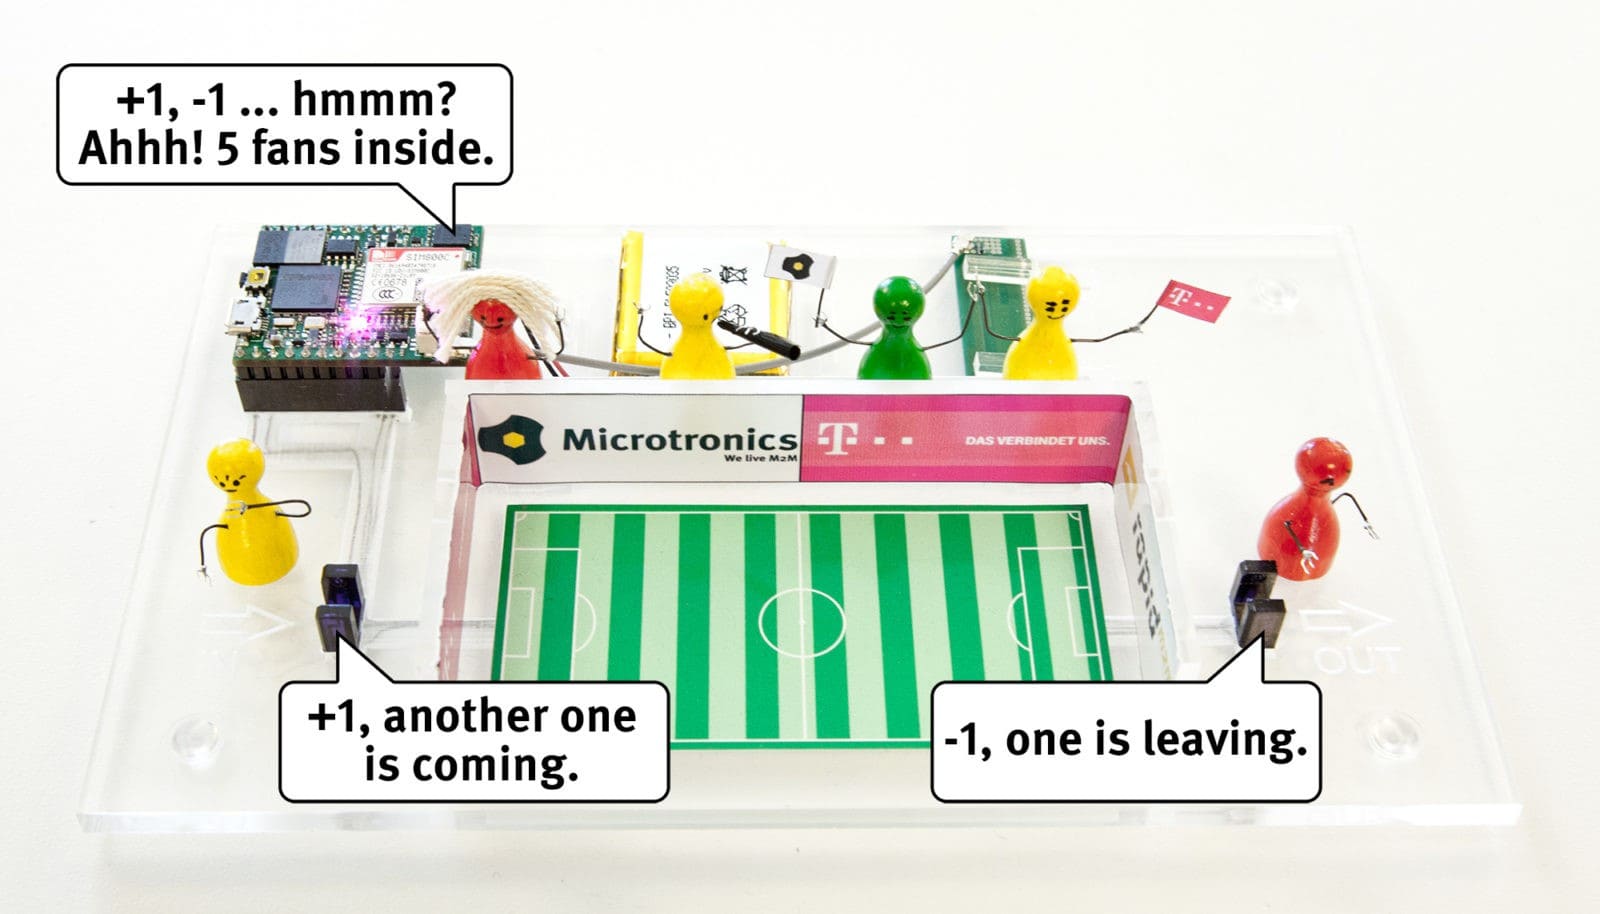
Demonstration unit “Smart Stadium”
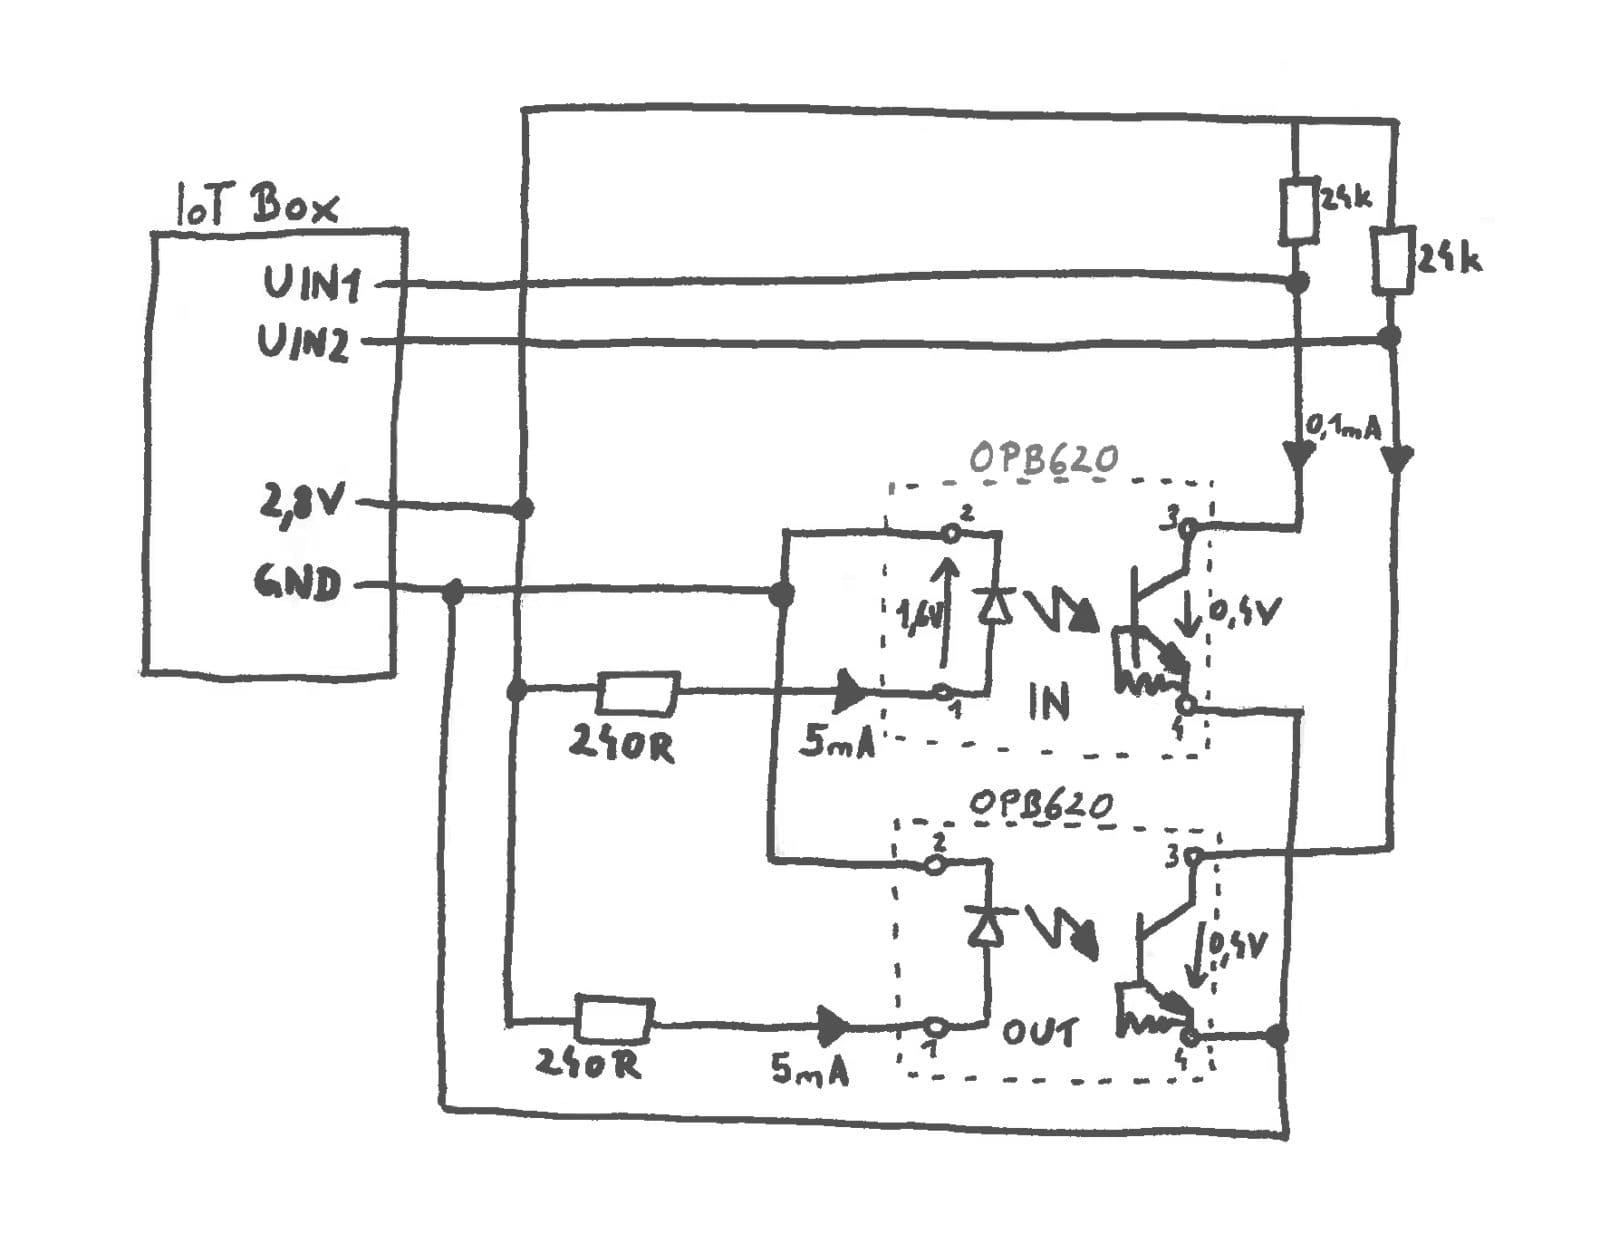
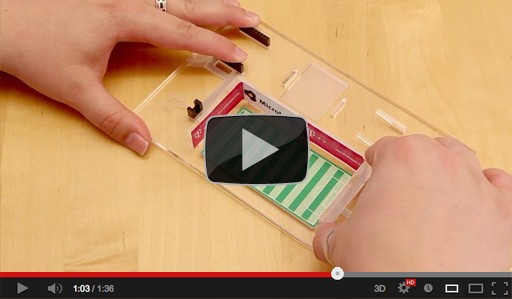
The two photoelectric fork sensors (OPB620) of the “Smart Stadium” are representative of conventional counters with pulse output, which we want to turn into smart meters. When interrupting the left-hand photoelectric sensor entering is simulated;interrupting the right-hand photoelectric sensor simulates leaving the stadium. The optical barriers are connected to the IoT box as shown in the picture.
Application script “Smart Counter”
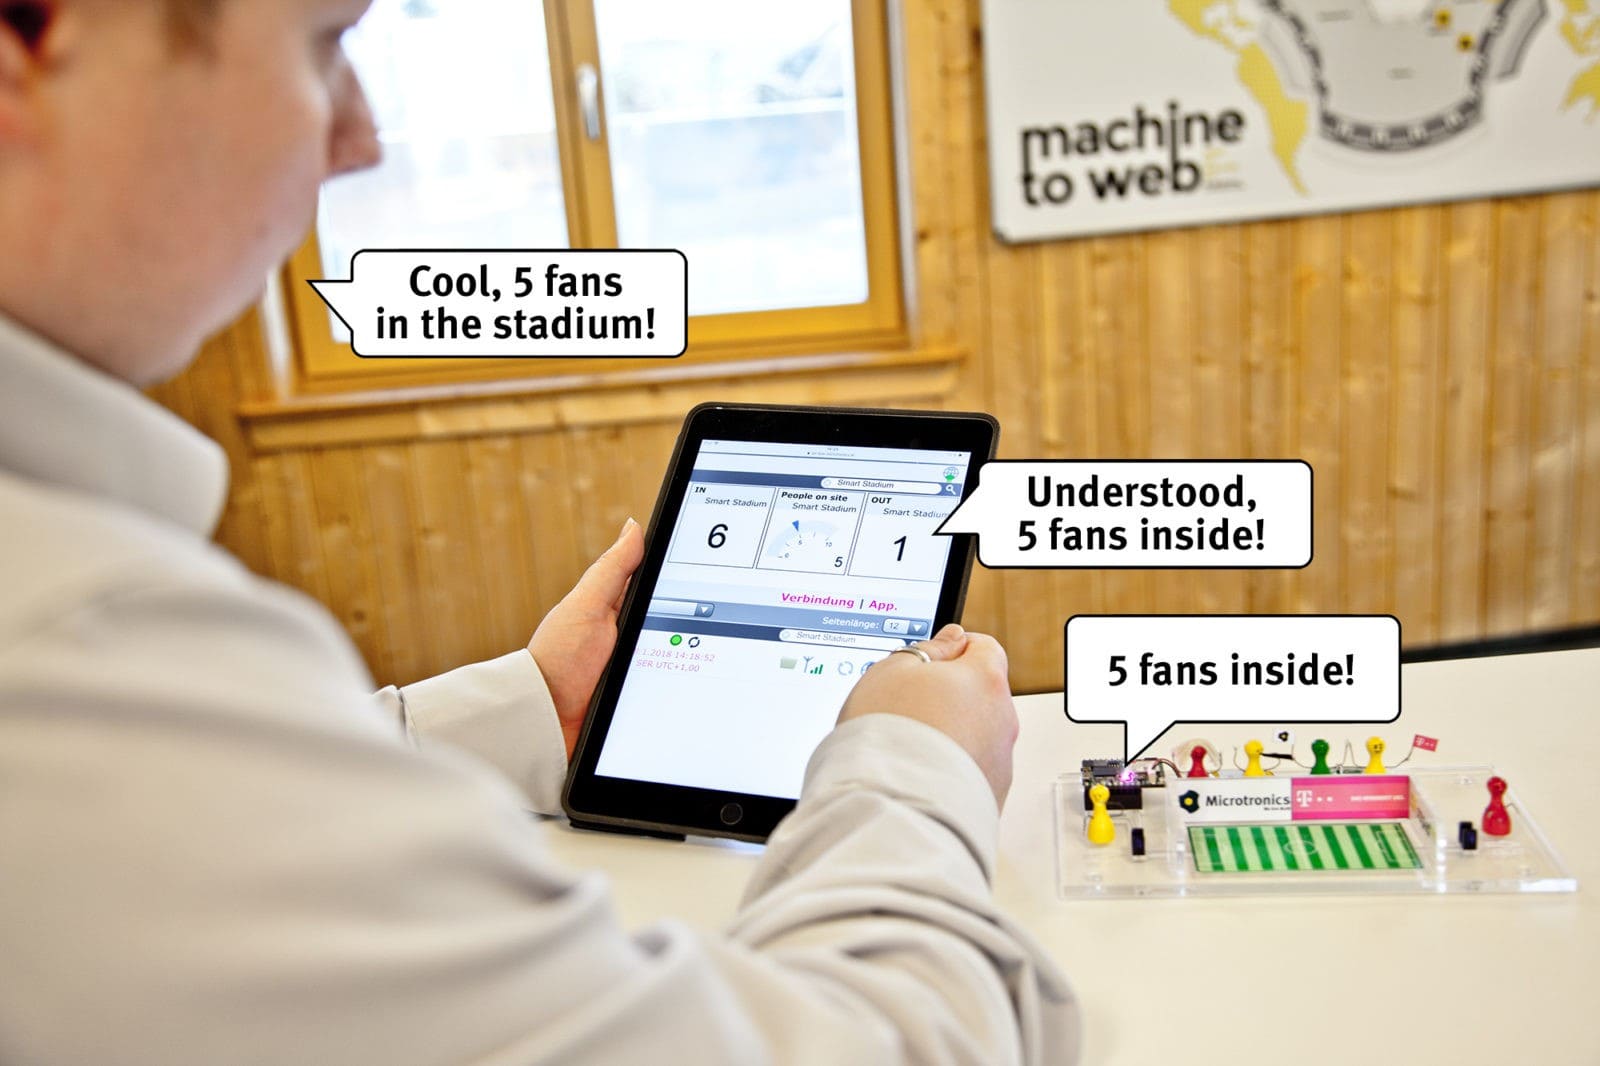
In phase 1 you load the application script “Smart Counter” into the IoT Box. The script adds separately the individual interruptions of the photoelectric barrier (impulses) for the entrance and the exit of the stadium and then calculates the difference. These 3 meter readings are transmitted to the cloud and displayed on the dashboard. Both the interval for the recording and the transmission of the meter readings can be configured.
If the connection type “online” is selected, the meter readings are transmitted to the cloud immediately after they have been recorded. This makes it possible at any time to determine how many people have entered the stadium, how many are currently in it and how many have already left. At the end of the event, the counters can be reset with a long press (>3sec.) and the “Smart Stadium” demonstration unit is ready for the next event.
If a connection type other than “online” is selected, a connection to the cloud is triggered either automatically by the IoT Box after expiration of the transmission interval or upon receipt of a Wackup SMS or manually by pressing the key for a short time (<3sec.).
The current operating status of the IoT Box is signaled by means of the RGB LED. When connected to the cloud, the LED lights up magenta. During connection setup the LED flickers magenta. If the last connection failed, the LED flashes red until the next connection attempt. If the last connection was successful and the IoT Box waits for the next contact with the cloud, the LED is switched off.
One script many possibilities
The script also provides the ability to multiply the pulses before adding with a configurable factor (i.e. a pulse weight). This will be used in phase 3. The use case is changed from counting people to monitoring energy flows. In this scenario, the left-hand photoelectric barrier represents the meter for the energy purchased from the grid operator. The right-hand photoelectric barrier determines the energy which the photovoltaic system of the stadium supplies back to the grid. The calculated difference thus indicates the actual absorbed energy.
By configurating the pulse value and adapting the so-called connector, a large number of counter applications can thus be realised without changing the application script. You can start immediately without any programming knowledge and connect the pulse output of one of your counters with the IoT Box replacing the optical barrier.
It is essential to observe the specification of the universal inputs given in the chapter “Technical Data” of the “Programmer’s Guide IoT Box”! In addition, the pulses must last at least for 10ms. This value can be changed by modifying the script.
The previously mentioned connector is used by the cloud to communicate the structure (the meaning of the individual bytes) of the data containers used (data blocks that are synchronised between the devices and the cloud). For more information, see the blog article “From sensor to the cloud – What?”.
Everything you need
The source code including a detailed description and all documents for the construction of the demonstration unit “Smart Stadium” can be downloaded free of charge.
Please note that the application script “Smart Counter” is a demonstration example that is reduced to the essential core functionalities.
“Smart Stadium” workshop
T-Mobile Austria organized a workshop for its customers in the Allianz Stadium of SK Rapid. During the workshop, the example of the “Smart Stadium” was worked through together.
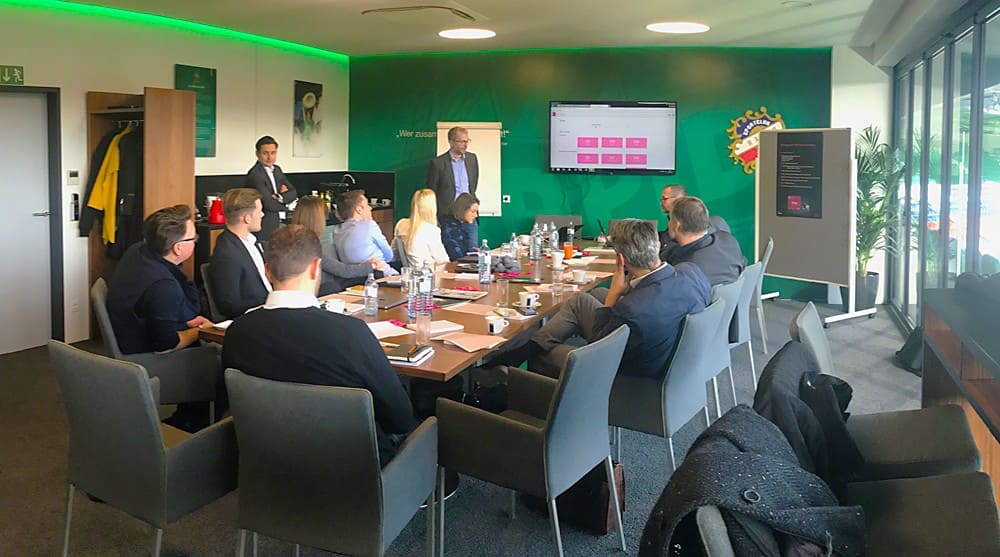
“Making digitization and the Internet of Things a reality requires an appropriate ecosystem and good partnerships. That we at T-Mobile and our long-term partner Microtronics are on the right track shows us the very positive feedback from all participants, ” Matthias Fiegl, Vice President of IoT & Big Data Services at T-Mobile Austria, says.
For schools and companies Microtronics offers free workshops with the “Smart Stadium”. In about 2 hours Head of Documentation Josef Posch will guide you through the tutorial and answer all your questions.